13_R
- hrafnulf13
- Nov 2, 2020
- 1 min read
Updated: Nov 4, 2020
Regression lines are useful in forecasting procedures. Its purpose is to describe the interrelation of the dependent variable (y variable) with one or many independent variables (x variable) [1]. Using the equation obtained from the regression line acts as an analyst who can forecast future behaviors of the dependent variables by inputting different values for the independent ones.
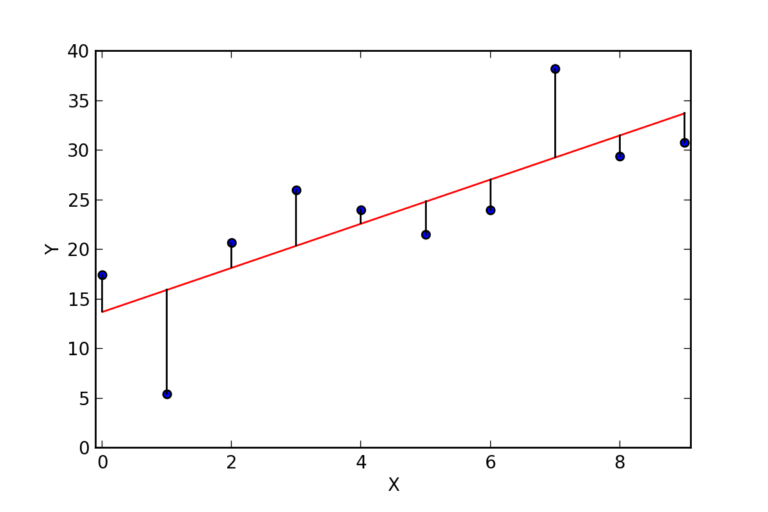
Regression Line Formula:
y = a + b*x
Multiple Regression Line Formula:
y = a + b1*x1 +b2*x2 + b3*x3 + … + bn*xn
where x's are the independent variables, y is the dependent variable, the slopes (coefficients) of the line are b's, and a is the intercept
A few key points about Linear Regression [2]:
Fast and easy to model and is particularly useful when the relationship to be modeled is not extremely complex and if you don’t have a lot of data.
Very intuitive to understand and interpret.
Linear Regression is very sensitive to outliers.
For the regression line where the regression parameters b0 and b1 are defined, the properties are given as [3]:
The line reduces the sum of squared differences between observed values and predicted values.
The regression line passes through the mean of X and Y variable values
The regression constant is equal to y-intercept the linear regression
The regression coefficient is the slope of the regression line which is equal to the average change in the dependent variable for a unit change in the independent variable .

Comments